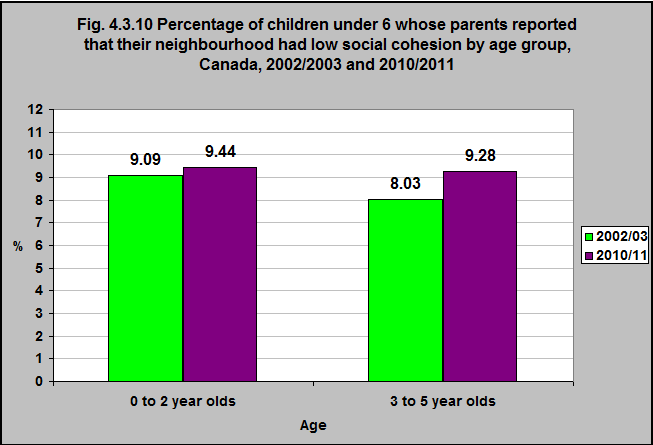
Percentage of children under 6 whose parents reported that their neighbourhood had low social cohesion by age group, Canada, 2002/2003 and 2010/2011
Note:
Low and high scores were determined by the 10th/90th percentile cutpoints (as appropriate).
CICH graphic created using data adapted from National Longitudinal Survey of Children and Youth 2002/2003, Statistics Canada – custom runs and Survey of Young Canadians 2010/2011, Statistics Canada – custom runs.
The proportion of 0 to 2 year-olds whose parents reported that their neighbourhood had a low social cohesion1 score remained relatively stable between 2002/03 and 2010/11.
That proportion increased for 3 to 5 year-olds during that same period.
1The purpose of the neighbourhood scales is to assess the extent of the presence/absence of certain neighbourhood characteristics. In particular, the neighbourhood cohesion scale can be used to measure the social unity of a neighbourhood (the extent to which the PMK- person most knowledgeable- feels that there is cohesion in the neighbourhood). Adult respondents were asked whether people in their neighbourhood are willing to help each other, deal with local problems, keep an eye open for possible trouble, and watch out for the safety of neighbourhood children, and whether they are people that their children can look up to. All questions about the neighbourhood were administered to the PMK or spouse/partner of the PMK. To identify low levels of neighbourhood cohesion, thresholds (or cutoff points) were established by taking the scale score that is closest to the 10th percentile based on Cycle 3 data for children in all provinces. The variable represents the proportion of children whose neighbourhoods exhibit lower levels of cohesion (as reported by the PMK) and those whose neighbourhoods do not. The Well-Being of Canada’s Young Children: Government of Canada Report 2011. Technical Notes. http://www.dpe-agje-ecd-elcc.ca/eng/ecd/well-being/page12.shtm-accessed July 24, 2017.