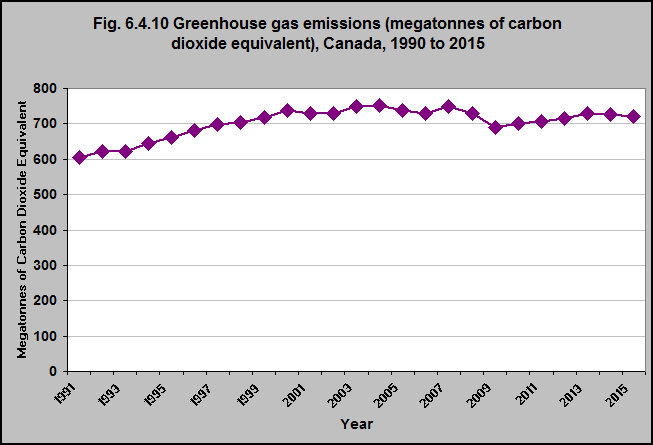
Greenhouse gas emissions (megatonnes of carbon dioxide equivalent), Canada, 1990 to 2015
Note: The national indicator tracks seven greenhouse gases (GHGs) released by human activity: carbon dioxide (CO2), methane (CH4), nitrous oxide (N2O), sulphur hexafluoride (SF6), perfluorocarbons (PFCs), hydrofluorocarbons (HFCs) and nitrogen trifluoride (NF3), reported in megatonnes of carbon dioxide equivalent (Mt CO2 eq). Emission levels for some previous years have been revised in light of improvements to estimation methods and availability of new data.
Source: CICH graphic created using data adapted from Environment and Climate Change Canada (2017) National Inventory Report 1990–2015: Greenhouse Gas Sources and Sinks in Canada. https://www.ec.gc.ca/indicateurs-indicators/?lang=en&n=FBF8455E-1- accessed May 21, 2017.
Greenhouse gases trap heat in the Earth’s atmosphere. The activities of people increase the amount of greenhouse gases in the atmosphere.
Over the past 200 years in particular, humans have released greenhouse gases into the atmosphere primarily from burning fossil fuels.1
In 2015, Canada’s total greenhouse gas (GHG) emissions were 722 megatonnes (Mt) of carbon dioxide equivalent (CO2 eq), or 20% (120 Mt CO2 eq) above the 1990 emissions. The first 10 years of this time period showed steady increases in annual emissions. There were fluctuating emission levels between 2000 and 2008 with a steep decline in 2009, and then levels gradually increased from 2010 to 2015.
The growth between 1990 and 2015 was mostly due to increased emissions from mining and upstream oil and gas production as well as transport.1
Reductions between 2005 and 2015 were due primarily to reduced emissions from the public electricity and heat production category.1
1Environment and Climate Change Canada (2017) National Inventory Report 1990–2015: Greenhouse Gas Sources and Sinks in Canada. https://www.ec.gc.ca/ges-ghg/default.asp?lang=En&n=662F9C56-1#figure-s-4– accessed May 21, 2017