Greenhouse gas emissions, by province and territory, Canada, 1990, 2005 and 2015
Notes:
Emission levels for some years have been revised in light of improvements to estimation methods and availability of new data.
1990 emissions data for the Northwest Territories include emissions for Nunavut, which was part of the Northwest Territories until 1999.
Source: CICH graphic created using data adapted from Environment and Climate Change Canada (2017) National Inventory Report 1990–2016: Greenhouse Gas Sources and Sinks in Canada. https://www.ec.gc.ca/indicateurs-indicators/default.asp?lang=en&n=18F3BB9C-1 – accessed May 21, 2017.
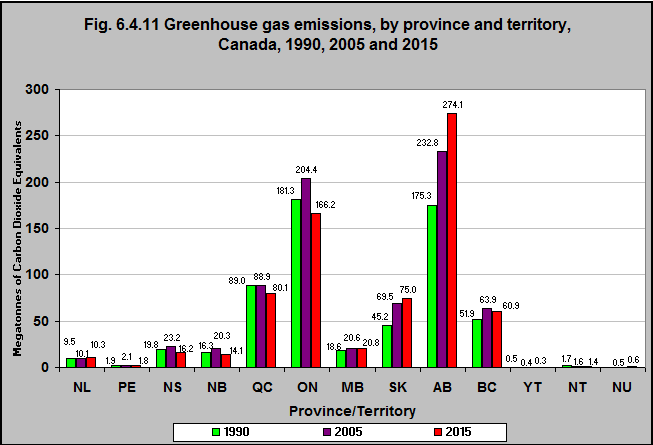
Greenhouse gas emissions (GHG) vary significantly by province and territory. This is due to differences in population, energy sources and economic base.
If everything else were equal, those provinces/territories whose economies are based on resource extraction would tend to have higher emission levels than those who rely on service-based economies.
Provinces/territories that rely on fossil fuels for their electricity generation will have higher emissions than provinces relying more on renewable sources.
Between 1990 and 2015, greenhouse gas emissions (measured as megatonnes of carbon dioxide equivalents) decreased in six provinces/territories (PEI, Nova Scotia, New Brunswick, Quebec, Ontario, the Northwest Territories and the Yukon*).
In contrast, greenhouse gas emissions increased in Newfoundland & Labrador, Manitoba, Saskatchewan, Alberta and British Columbia. The biggest increases were in Saskatchewan (67% increase) and Alberta (56% increase).
The five provinces with the highest emissions – Alberta, Ontario, Quebec, Saskatchewan and British Columbia – released a total of 656 megatonnes of carbon dioxide equivalent, or 91% of Canada’s national total green house gas (GHG) emissions of 722 of megatonnes of carbon dioxide equivalent (Mt CO2 eq) in 2015.
Alberta has the highest emissions due to the oil and gas industry for export markets. Quebec and British Columbia rely on abundant hydroelectric resources for their electricity production and have shown more stable emission patterns since 1990, and a decreasing trend since 2005.
*1990 emissions data for the Northwest Territories include emissions for Nunavut, which was part of the Northwest Territories until 1999.