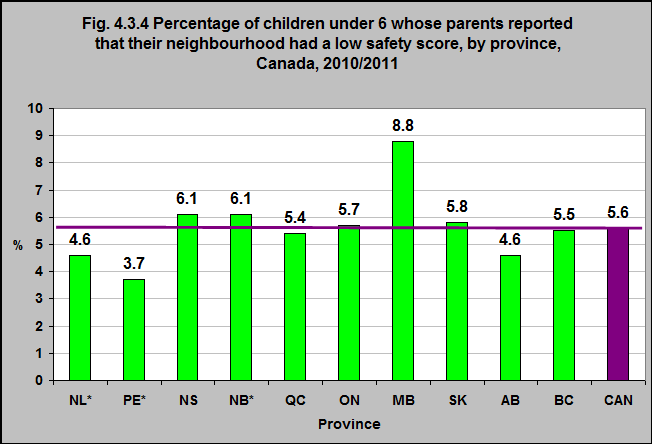
Percentage of children under 6 whose parents reported that their neighbourhood had a low safety score, by province, Canada, 2010/2011
Notes:
*Use with caution
Low and high scores were determined by the 10th/90th percentile cutpoints (as appropriate).
Source: CICH graphic created using data adapted from the Survey of Young Canadians 2010/2011, Statistics Canada – custom runs.
In 2010/11, almost 6% of children under 6 lived in neighbourhoods that their parents felt had low levels of neighbourhood safety1.
This proportion varied between provinces and territories.
The highest proportion was in Manitoba (9%) and the lowest in Prince Edward Island (4%).
1The neighbourhood safety scale can be used to measure the extent to which the PMK (person most knowledgeable) feels that there is a sense of safety in the neighbourhood. All questions about the neighbourhood were administered to the PMK or spouse/partner of the PMK. To identify low levels of neighbourhood safety, thresholds (or cutoff points) were established by taking the scale score that is closest to the 10th percentile based on Cycle 4 data (because the question was not asked in Cycle 3) for children in all provinces. The variable represents the proportion of children living in neighbourhoods with a lower sense of safety (as reported by the PMK) and those who do not. The Well-Being of Canada’s Young Children: Government of Canada Report 2011. Technical Notes. http://www.dpe-agje-ecd-elcc.ca/eng/ecd/well-being/page12.shtml-accessed July 24, 2017.