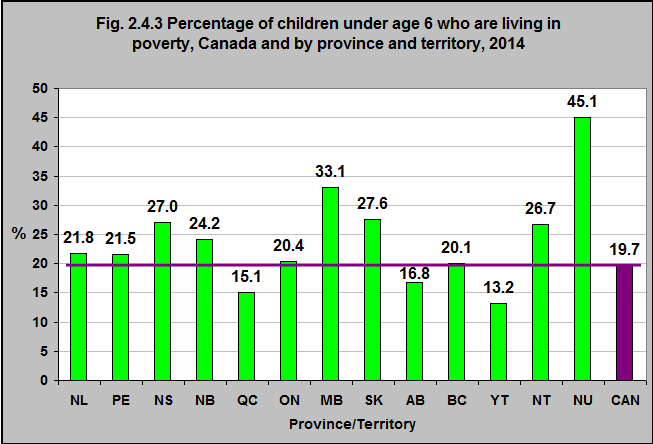
Percentage of children under age 6 who are living in poverty, Canada and by province and territory, 2014
*Low income can be measured in several different ways in household surveys. For the standard products of the National Household Survey, the line chosen is a relative measure: the after-tax low-income measure (LIM-AT). For this measure, the income used is after-tax income of households. There are no regional variations to account for prices or cost of living differences: all applicable households in Canada face the same line adjusted for household size. This line is set at half the median of adjusted household after-tax income. To account for potential economies of scale, the income of households with more than one member is divided by the square root of the size of the household. All household members are considered to share the household income and are attributed the same income status. Note: Low-income estimates in the 2011 National Household Survey For the 2011 National Household Survey (NHS), low-income statistics are presented based on the after-tax low-income measure (LIM-AT). This measure is not related to the low-income cut-offs (LICO) presented in the 2006 Census and prevalence rates are conceptually not comparable. Because of the sensitivity of certain income indicators to differences in methodology and response patterns, direct comparisons to establish trends with low-income estimates from other household surveys, administrative programs or the 2006 Census are discouraged. The prevalence rates observed in the NHS at the national level are generally 1 to 2 percentage points higher than seen for similar concepts in other programs. However, analysis of the NHS data suggests that it is valid to compare low-income data for different sub-populations within the NHS (i.e., for different geographic areas or demographic groups). For more information, refer to the Income Reference Guide, National Household Survey, Catalogue no. 99-014-X2011006.
Source: CICH graphic created using data adapted from Campaign 2000 Report Card on Child & Family Poverty in Canada, 2016. A Road Map to Eradicate Family Poverty. http://campaign2000.ca/wp-content/uploads/2016/11/Campaign2000NationalReportCard2016Eng.pdf July 16, 2017.
For the purposes of this module we are using the Low Income Measurement (LIM)*. In 2014, 19.7% of all children under 6 were living in poverty – or below the LIM.
That proportion ranged from a low of 13.2% in the Yukon to a high of 45% in Nunavut.
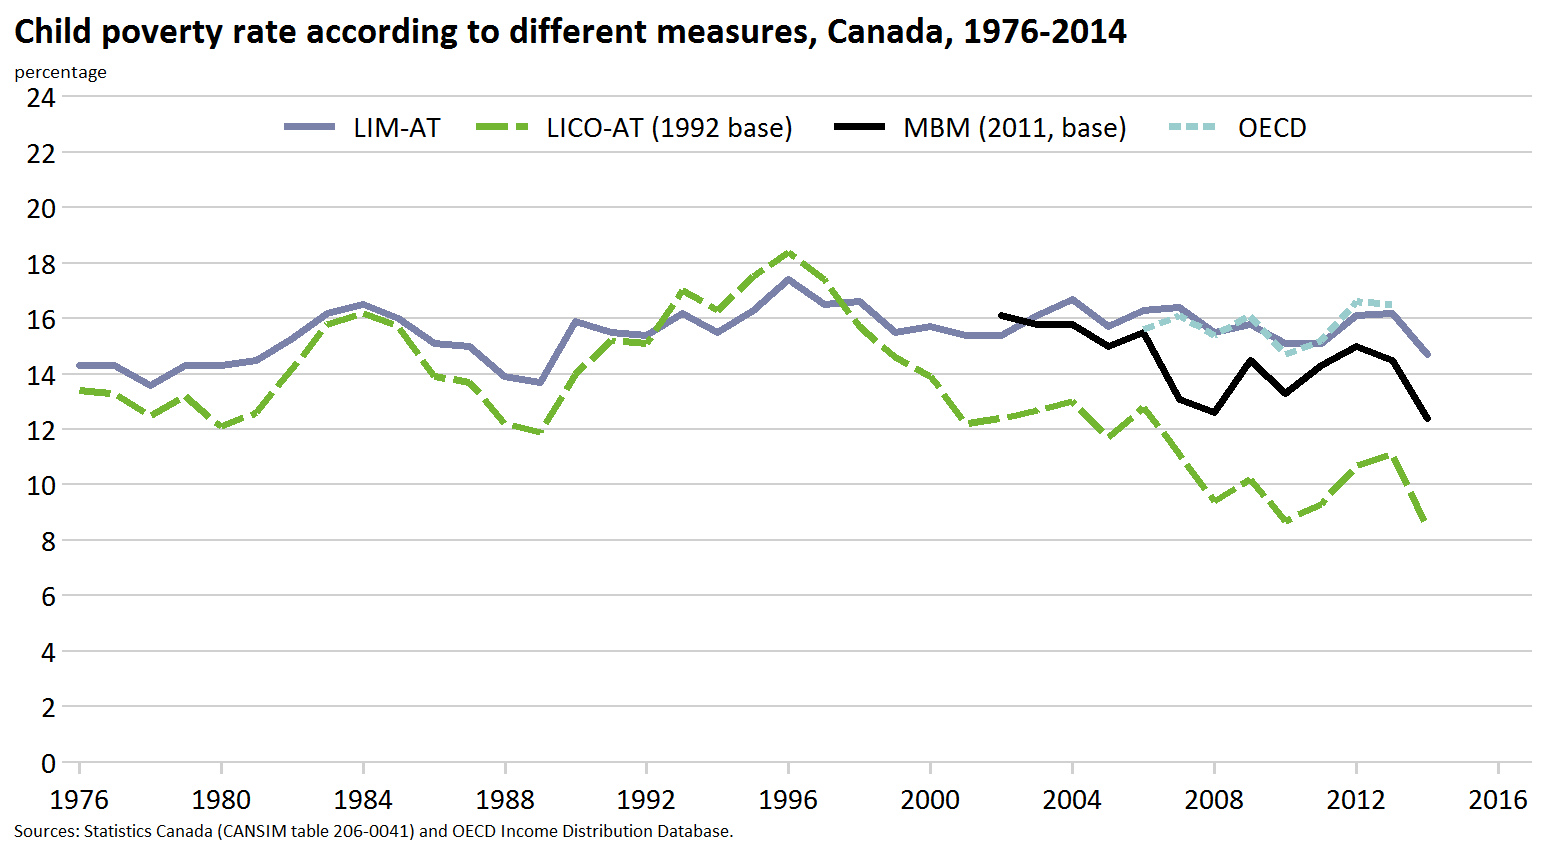
Click here to review a report that compares the LICO, LIM and Market Basket Measure.
For an infographic that compares the LICO, LIM and Market Basket Measure click here.
Implications
Children living in poverty are more likely to have chronic illnesses and to die from unintentional injuries. They are more likely to experience emotional, behavioural, learning and social problems. In addition, children who live in poverty are more likely to have chronic illnesses – such as heart disease and diabetes – as adults.1,2
1Raphael D. 2011. Poverty and Policy in Canada: Implications for Health and Quality of Life. 2nd Ed. Toronto: Canadian Scholars’ Press Inc. https://www.canadianscholars.ca/books/poverty-in-canada accessed July 16.
2Irwin LG, Siddiqi A & Hertzman C. Early Childhood Development: A Powerful Equalizer. World Health Organization’s Commission on the Social Determinants of Health. 2007. http://www.who.int/social_determinants/resources/ecd_kn_report_07_2007.pdf – accessed July 21, 2017