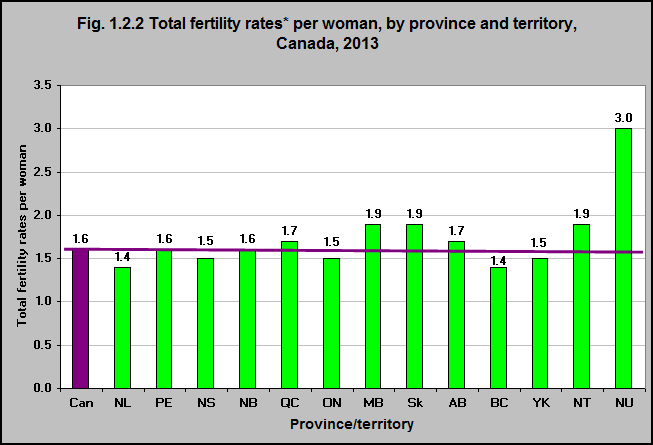
Total fertility rates per 1,000 women, by province and territory, 2013
Source: CICH graphic created using data adapted from Statistics Canada, Table 102-4505 – Crude birth rate, age-specific and total fertility rates (live births), Canada, provinces and territories, annual (rate). http://www5.statcan.gc.ca/cansim/a26?lang=eng&retrLang=eng&id=1024505&&pattern=&stByVal=1&p1=1&p2=38&tabMode=dataTable&csid= -accessed March 15, 2017.
In 2013 the total fertility rate per 1,000 women was 1,587 or about 1.6 babies per woman.
This varied from a low of just over 1,400 (1.4 babies per woman) in Newfoundland & Labrador and British Columbia to a high of over 3,000 (3 babies per woman) in Nunavut.
This total fertility rate has been relatively stable since the mid-1970s but is less than half of what it was in 1960. The fertility rate among Indigenous women is also decreasing. However, in 2010/11 their fertility rate (2.2) was higher than the Canadian average.2
*The total fertility rate refers to the number of children that a woman would have over the course of her reproductive life if she experienced the age-specific fertility rates observed in a particular calendar year. It is based on a compilation of the fertility experiences of many different cohorts of women in a given year.1
1Fertility: Overview, 2009 to 2011. Component of Statistics Canada Catalogue no. 91-209-X Report on the Demographic Situation in Canada, 2013. http://www.statcan.gc.ca/pub/91-209-x/2013001/article/11784-eng.pdf
2 Indigenous ECD section Figure 5.1.3 Number of children per woman (total fertility rate) by Indigenous identity*, Canada, 2010-2011 – https://cichprofile.ca/module/7/section/5/page/number-of-children-per-woman-total-fertility-rate-by-indigenous-identity-canada-2010-2011/