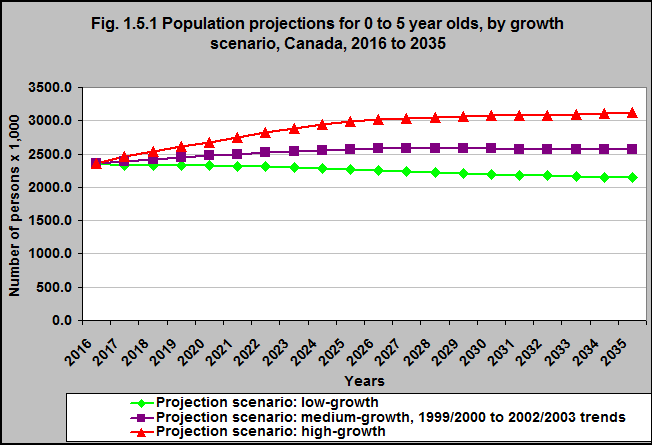
Population projections for 0 to 5 year olds, by growth scenario, Canada, 2016 to 2035
Notes:
2016 is the actual estimate in all three scenarios.
The low-growth scenario is defined by the following assumptions: a Canadian total fertility rate that reaches 1.53 births per woman in 2021/2022 and remains constant thereafter; a Canadian life expectancy that reaches 85.9 years for males and 87.1 years for females in 2062/2063; interprovincial migration based on the trends observed between 1991/1992 and 2010/2011; a national immigration rate that reaches 0.5% in 2022/2023 and remains constant thereafter; an annual number of non-permanent residents (Canada) that reaches 733,600 in 2014 and remains constant thereafter; a national net emigration rate of 0.16%.
The medium-growth and 1999/2000 to 2002/2003 interprovincial migrations trends scenario is defined by the following assumptions: a Canadian total fertility rate that reaches 1.67 births per woman in 2021/2022 and remains constant thereafter; a Canadian life expectancy that reaches 87.5 years for males and 89.1 years for females in 2062/2063; interprovincial migration based on the trends observed between 1999/2000 and 2002/2003; a national immigration rate that reaches 0.75% in 2022/2023 and remains constant thereafter; an annual number of non-permanent residents (Canada) that reaches 864,600 in 2021 and remains constant thereafter; a national net emigration rate of 0.19%.
The high-growth scenario is defined by the following assumptions: a Canadian total fertility rate that reaches 1.88 births per woman in 2021/2022 and remains constant thereafter; a Canadian life expectancy that reaches 89.9 years for males and 91.9 years for females in 2062/2063; interprovincial migration based on the trends observed between 1991/1992 and 2010/2011; a national immigration rate that reaches 0.9% in 2022/2023 and remains constant thereafter; an annual number of non-permanent residents (Canada) that reaches 1,144,300 in 2031 and remains constant thereafter; a national net emigration rate of 0.21%.
Source: CICH graphic created using data adapted from Statistics Canada CANSIM Table 052-0005. Projected population, by projection scenario, age and sex, as of July 1, Canada, provinces and territories, annual (persons x 1,000). http://www5.statcan.gc.ca/cansim/a26?lang=eng&retrLang=eng&id=0520005&&pattern=&stByVal=1&p1=1&p2=37&tabMode=dataTable&csid= -accessed March 19, 2017.
Based on a medium growth projection, it is projected that there will be approximately 2.6 million children under 6 living in Canada in 2035 – up from 2.4 million in 2017.
Based on high growth projections the number of young children will rise from 2.4 million to 3.1 million.
Based on low growth projections the number of young children will decrease from 2.4 million to 2.1 million.