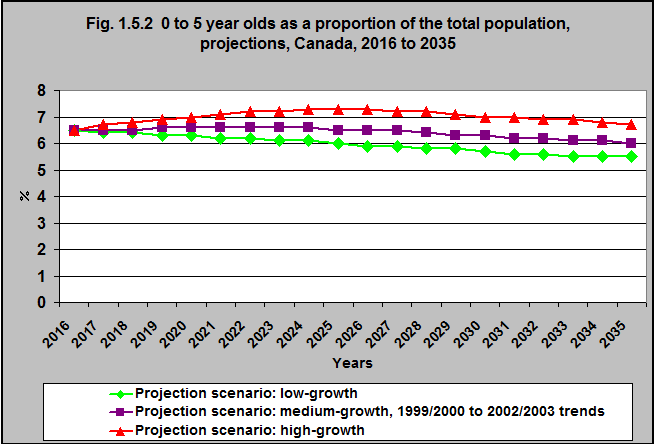
0 to 5 year olds as a proportion of the total population, projections, Canada, 2016 to 2035
Notes:
The low-growth scenario is defined by the following assumptions: a Canadian total fertility rate that reaches 1.53 births per woman in 2021/2022 and remains constant thereafter; a Canadian life expectancy that reaches 85.9 years for males and 87.1 years for females in 2062/2063; interprovincial migration based on the trends observed between 1991/1992 and 2010/2011; a national immigration rate that reaches 0.5% in 2022/2023 and remains constant thereafter; an annual number of non-permanent residents (Canada) that reaches 733,600 in 2014 and remains constant thereafter; a national net emigration rate of 0.16%.
The medium-growth and 1999/2000 to 2002/2003 interprovincial migrations trends scenario is defined by the following assumptions: a Canadian total fertility rate that reaches 1.67 births per woman in 2021/2022 and remains constant thereafter; a Canadian life expectancy that reaches 87.5 years for males and 89.1 years for females in 2062/2063; interprovincial migration based on the trends observed between 1999/2000 and 2002/2003; a national immigration rate that reaches 0.75% in 2022/2023 and remains constant thereafter; an annual number of non-permanent residents (Canada) that reaches 864,600 in 2021 and remains constant thereafter; a national net emigration rate of 0.19%.
The high-growth scenario is defined by the following assumptions: a Canadian total fertility rate that reaches 1.88 births per woman in 2021/2022 and remains constant thereafter; a Canadian life expectancy that reaches 89.9 years for males and 91.9 years for females in 2062/2063; interprovincial migration based on the trends observed between 1991/1992 and 2010/2011; a national immigration rate that reaches 0.9% in 2022/2023 and remains constant thereafter; an annual number of non-permanent residents (Canada) that reaches 1,144,300 in 2031 and remains constant thereafter; a national net emigration rate of 0.21%.
Source: CICH graphic created using data adapted from Statistics Canada CANSIM Table 052-0005. Projected population, by projection scenario, age and sex, as of July 1, Canada, provinces and territories, annual (persons x 1,000). http://www5.statcan.gc.ca/cansim/a26?lang=eng&retrLang=eng&id=0520005&&pattern=&stByVal=1&p1=1&p2=37&tabMode=dataTable&csid= -accessed March 19, 2017.
According to a medium-growth scenario, it is projected that children under 6 will represent 6.0% of the population in 2035 – down from 6.5% in 2016.
According to a high-growth scenario, it is projected that children under 6 will represent 6.7% of the population in 2035 – up from 6.5% in 2016.
According to a low-growth scenario, it is projected that children under 6 will represent 5.5% of the total population in 2035, down from 6.5% in 2016.
Implications
In spite of the increasing life expectancy, and increasing numbers of older Canadians, children under 6 will continue to represent a significant proportion of the population in future years. Therefore, they will continue to require policies and programs that support their well-being and healthy development.